
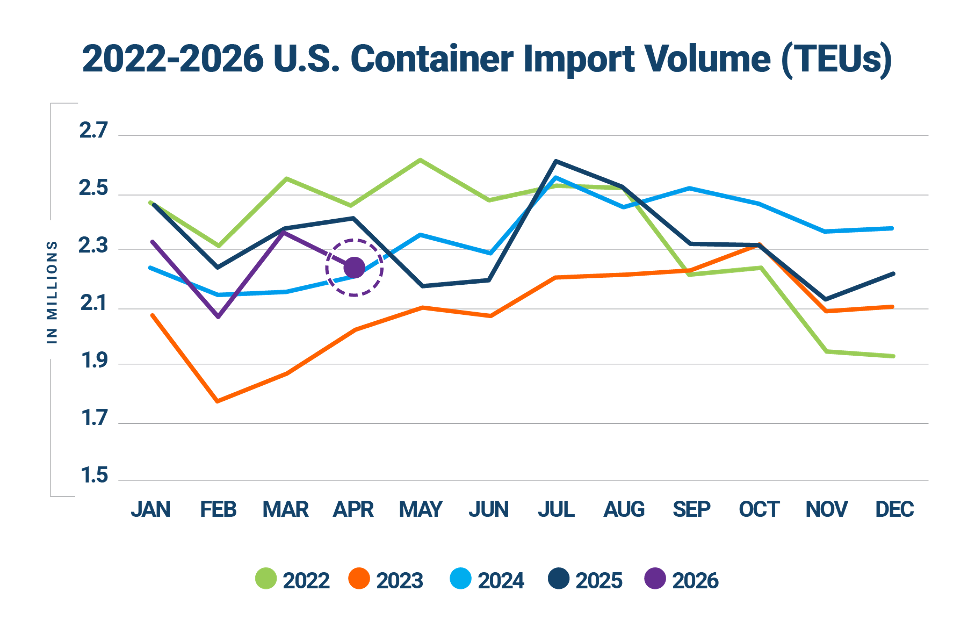
US container imports eased in April 2026, totalling 2.28 million TEU, down 3.2% from March and 5.5% below April 2025, according to Descartes Systems Group’s May Global Shipping Report. Despite the pullback, volumes remained 18.7% above April 2019 pre-pandemic levels. Year-to-date imports trail 2025 by 5%.
China-origin imports continued their decline, falling 4.3% month-on-month to 680,778 TEU. That figure sits 15.3% below April 2025 and 33.4% below the July 2024 peak of 1.02 million TEU. China’s share of total US container imports fell to 29.9%.
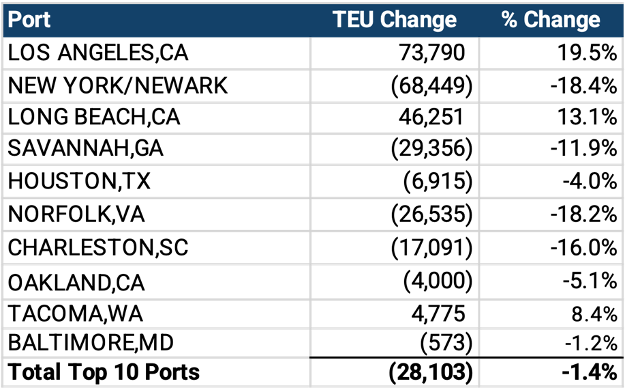
West Coast ports regained market share leadership from East and Gulf Coast ports after briefly trailing in March. Los Angeles posted the largest monthly gain among major gateways, rising 19.5%. Long Beach added 13.1%. In contrast, New York/Newark fell 18.4%, Norfolk dropped 18.2% and Charleston declined 16%. The swings largely reflect routing shifts rather than fundamental demand changes.
Among the top ten countries of origin, Japan recorded the strongest gain, up 64,479 TEU. Thailand and Indonesia also posted solid increases. China drove the overall decline.
The broader trade environment remains complex. Middle East tensions continue to disrupt the Strait of Hormuz and the Red Sea-Bab al-Mandeb corridor, pushing up transit times and fuel costs. US tariff policy also remains unsettled. The first refunds of invalidated tariffs are expected to begin on May 12, but replacement tariffs remain in force and trade negotiations with the EU, India and China are all unresolved.
The Federal Reserve held rates steady at 3.50%-3.75% at its April 29 meeting. US GDP grew at a 2% annualised rate in Q1 2026, rebounding from 0.5% in Q4 2025.


