
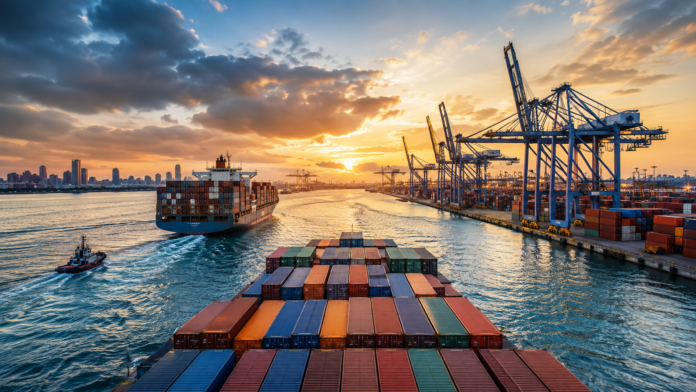

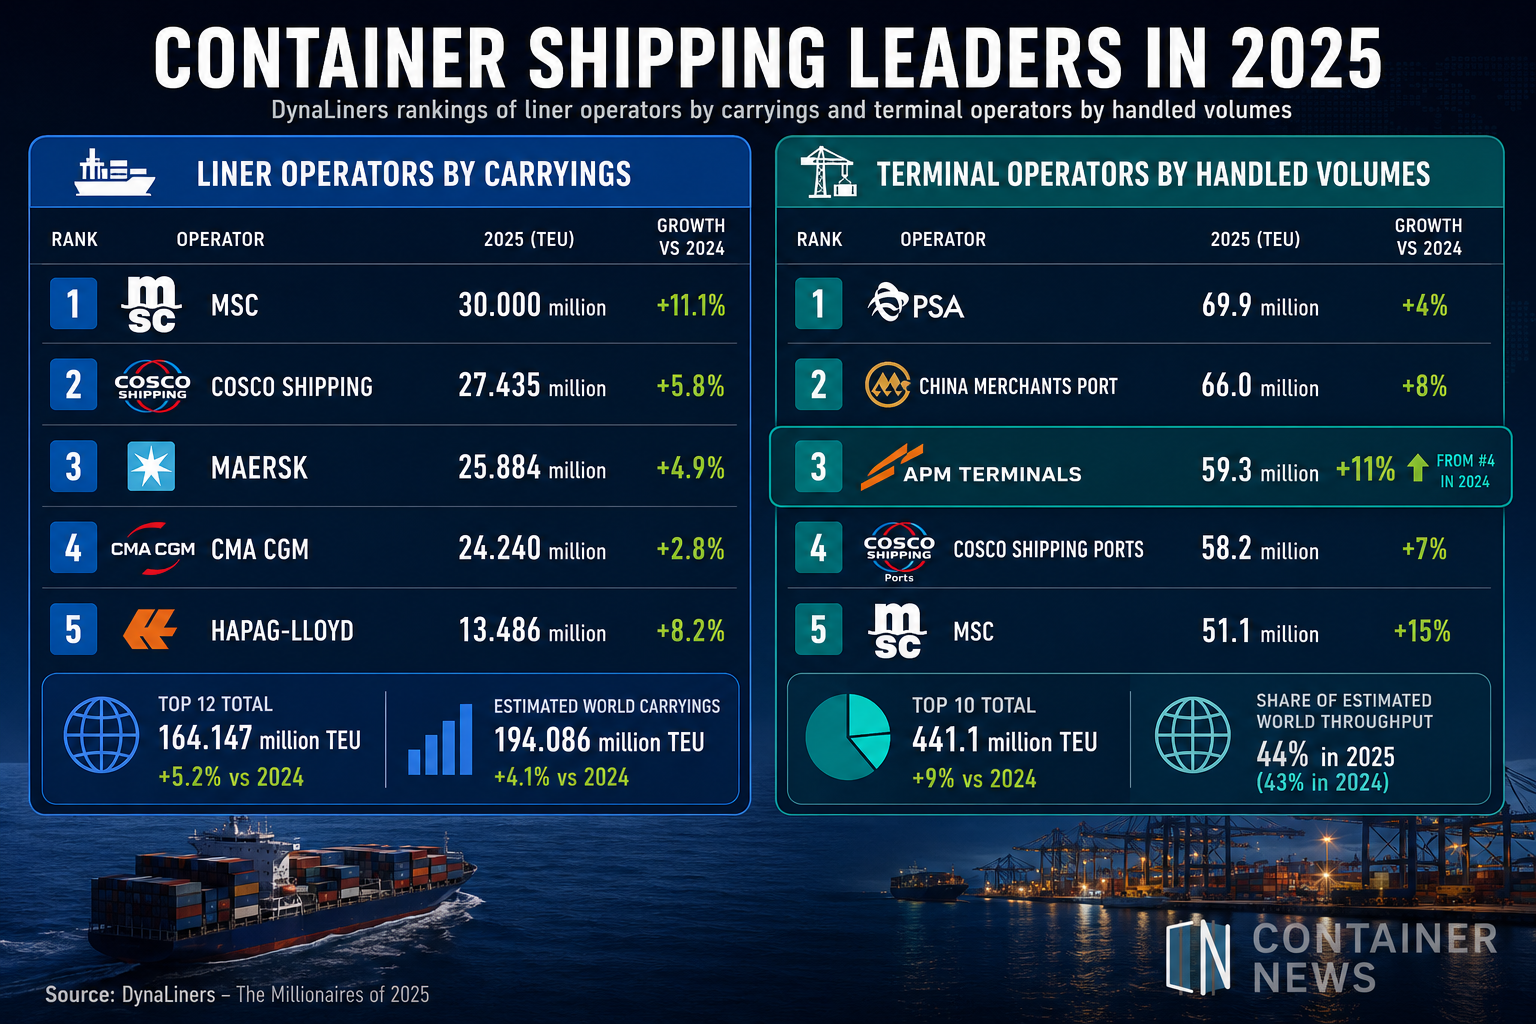
MSC and APM Terminals strengthened their positions across global container shipping rankings in 2025, according to DynaLiners. MSC remained the world’s largest container carrier by volumes carried, while APM Terminals climbed to third place in the global terminal operator ranking.
MSC carried 30 million TEU during the year, up 11.1% from 27 million TEU in 2024. COSCO Shipping remained second with 27.435 million TEU, while Maersk ranked third with 25.884 million TEU.
In the separate terminal operator ranking, APM Terminals handled 59.3 million TEU, up 11% from 53.2 million TEU in 2024. The increase lifted the company from fourth to third place.
MSC increases lead over COSCO and Maersk
MSC recorded stronger growth than its nearest competitors in 2025.
COSCO Shipping’s volumes increased 5.8%, from 25.939 million TEU in 2024 to 27.435 million TEU. As a result, the gap between MSC and COSCO widened from about 1.06 million TEU in 2024 to 2.57 million TEU in 2025, based on the DynaLiners figures.
Maersk recorded growth of 4.9%, with volumes rising from 24.676 million TEU to 25.884 million TEU. MSC’s lead over Maersk therefore increased from about 2.32 million TEU to 4.12 million TEU.
CMA CGM remained fourth, carrying 24.24 million TEU in 2025, up 2.8% from 23.57 million TEU.
Hapag-Lloyd followed with 13.486 million TEU, an increase of 8.2% from 12.467 million TEU in 2024.
PIL posts strongest percentage growth
PIL recorded the highest percentage increase among the 12 liner operators included in the DynaLiners table.
Its volumes rose 16.7% to 2.58 million TEU, compared with 2.21 million TEU in 2024. MSC followed with growth of 11.1%, while Hapag-Lloyd increased 8.2%.
COSCO Shipping grew 5.8%, Maersk 4.9% and Evergreen 3.6%. HMM recorded growth of 3.1%, while ONE increased 1.4% and Wan Hai edged up 0.6%.
Two carriers recorded lower volumes. Yang Ming’s carryings declined 6.3% to 4.419 million TEU from 4.718 million TEU, while ZIM fell 2.3% to 3.663 million TEU from 3.751 million TEU.
Overall, the 12 liner operators carried a combined 164.147 million TEU in 2025, up 5.2% from 156.074 million TEU in 2024.
DynaLiners estimated total worldwide liner carryings at 194.086 million TEU, representing growth of 4.1% from 186.487 million TEU a year earlier.
MSC and APM Terminals feature among terminal leaders
A separate DynaLiners terminal operator ranking also places MSC and APM Terminals among the world’s five largest terminal operator groups by handled volumes.
PSA retained first place, handling 69.9 million TEU in 2025, up 4% from 67.3 million TEU in 2024.
China Merchants Port remained second with 66 million TEU, an increase of 8% from 61.2 million TEU.
APM Terminals climbed from fourth to third after its volumes increased 11% to 59.3 million TEU. It overtook COSCO Shipping Ports, which moved from third to fourth despite recording 7% growth to 58.2 million TEU.
MSC ranked fifth among the terminal operator groups, with volumes increasing 15% from 44.4 million TEU to 51.1 million TEU.
DP World advanced from seventh to sixth place after recording 12% growth to 49.4 million TEU. Hutchison Ports moved from fifth to seventh, although its volumes increased 3% to 47.6 million TEU.
CMA CGM records fastest terminal operator growth
CMA CGM posted the strongest percentage growth among the Top 10 terminal operator groups in the DynaLiners ranking.
Its volumes increased 22% to 15.8 million TEU from 12.9 million TEU in 2024, while the company retained eighth place.
MSC followed with 15% growth, while DP World increased 12%. APM Terminals and ICTSI each grew 11%, China Merchants Port increased 8%, COSCO Shipping Ports rose 7%, Yilport grew 6%, PSA increased 4% and Hutchison Ports recorded 3% growth.
Combined volumes among the Top 10 terminal operator groups reached 441.1 million TEU in 2025, up 9% from 405.6 million TEU in 2024.
Their share of estimated global container port throughput increased to 44%, compared with 43% a year earlier.