

The data shows that inventories in the US are not declining, despite the continuing negative growth in container import volumes. While the inventory‑to‑sales ratio has been declining, the data indicates that this is driven by sales growth outpacing inventory growth, rather than a reduction in absolute inventory levels.
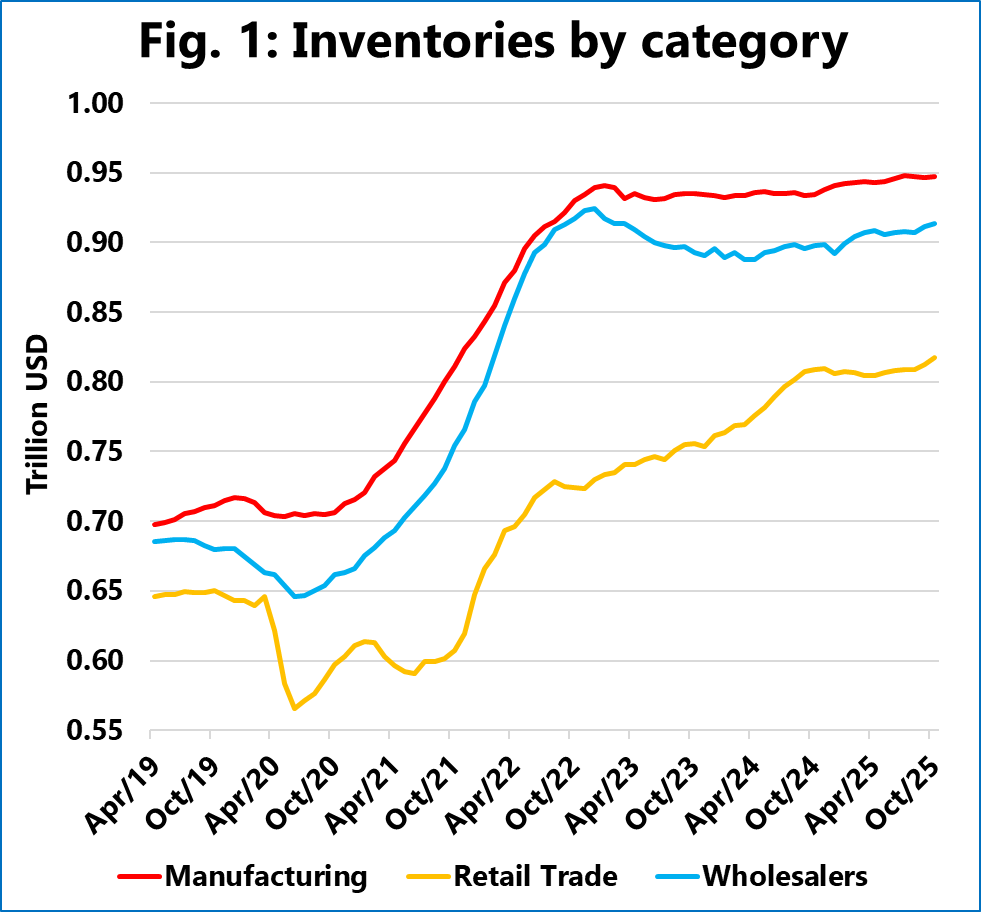
Figure 1 illustrates the development of the magnitude of inventories over the past 8 years. As the data shows, inventories are not being reduced but are instead gradually increasing. While the inventory build-up is slowing down – almost to the point of stalling – it is still not declining. However, sales are growing across the spectrum, and at a higher rate than the inventory.
This creates a discrepancy in the data. If US sales are showing healthy growth of around 4% Y/Y, while US containerised imports are contracting at around -6% Y/Y, we should expect the difference to be made up by a draw-down of US inventories, but that is not the case.
It is possible that this discrepancy could partly be explained by timing between the sources, and that the coming US inventory data will show a strong contraction. One explanation could be the movement of imports by other means than containers. Another could be a change in trading terms, leading to importing companies shifting their ownership recognition of goods purchased to be earlier than usual; this would technically result in an increase in the financial measure of inventories, even without a corresponding increase in physical container flow. For now, all Sea‑Intelligence can say is that this discrepancy does indeed look peculiar.


