

Global container port throughput reached an estimated 1.012 billion TEU in 2025, rising 8% from the previous year, according to DynaLiners’ latest Millionaires report.
The estimated worldwide total increased from 937.3 million TEU in 2024 and 876 million TEU in 2023.
At the same time, 171 ports handled more than 1 million TEU during 2025. Together, these ports processed approximately 884 million TEU, up 6% from 830.9 million TEU a year earlier.
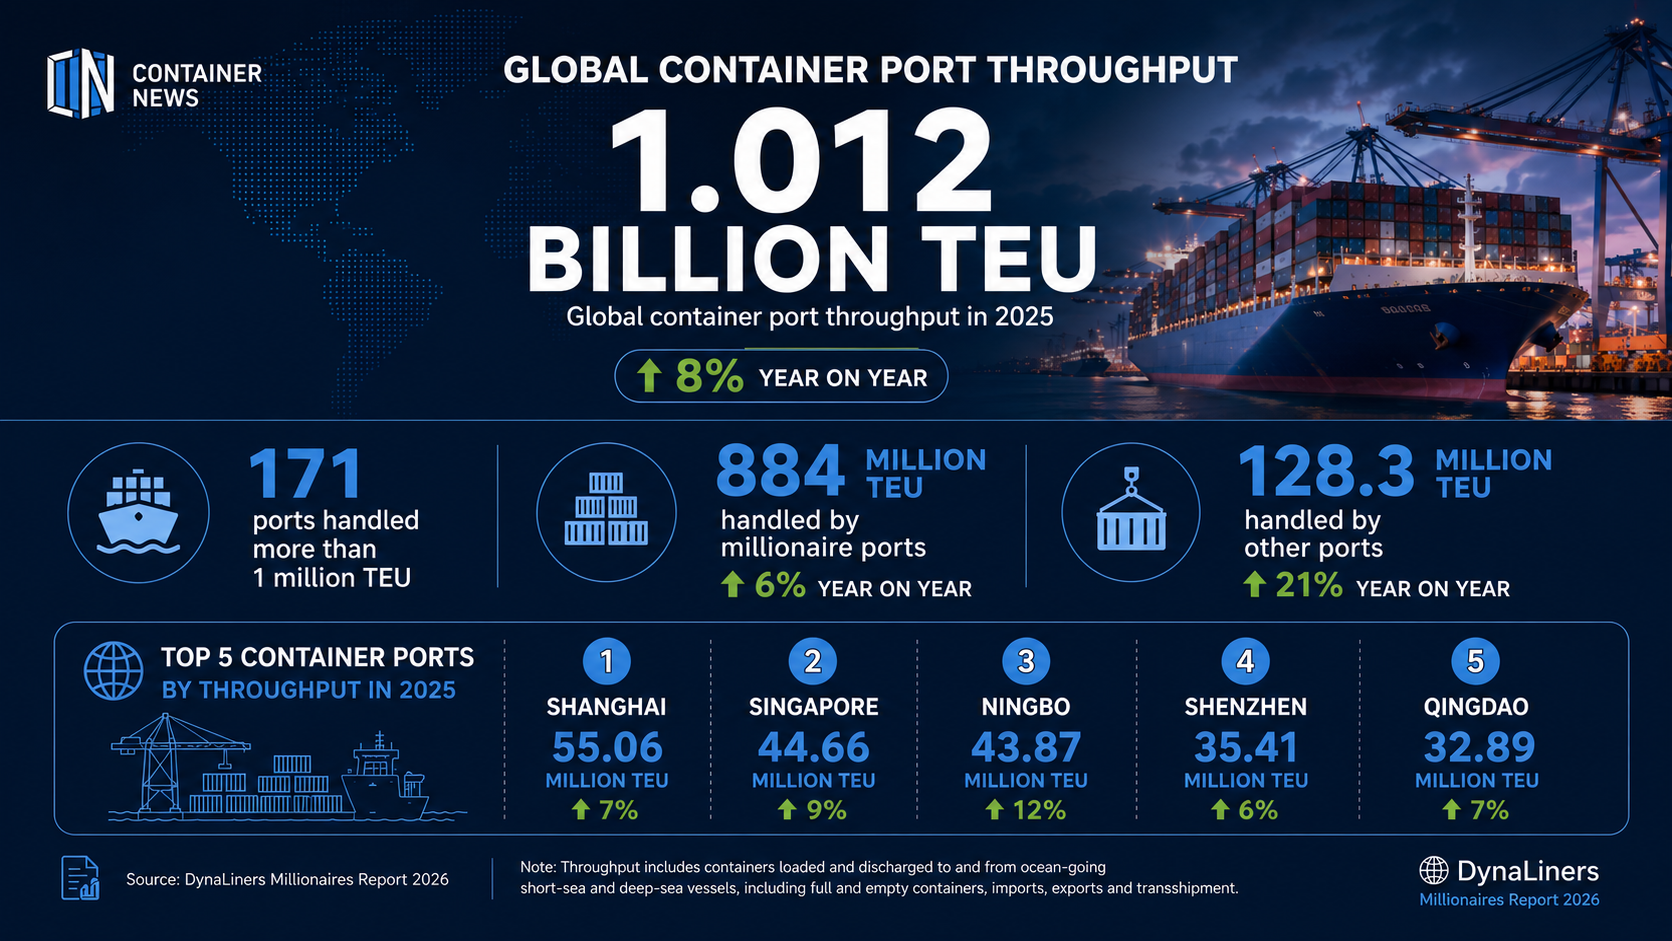
Despite the increase, their share of estimated global container port throughput declined from 89% in 2024 to 87% in 2025.
Ports outside the million-TEU group grew considerably faster. Their combined throughput climbed 21% to 128.3 million TEU, compared with 106.4 million TEU in 2024.
The figures indicate that growth in global container handling during 2025 extended beyond the largest ports, with smaller gateways collectively expanding at a faster rate.
Far East dominates container port volumes
The Far East remained by far the largest trade area among ports handling more than 1 million TEU.
Its 63 qualifying ports processed a combined 531.2 million TEU in 2025, representing growth of 6% year on year.
North America ranked second with 70 million TEU across 19 ports, followed by North Europe with 60.5 million TEU across 14 ports.
However, the strongest percentage growth came from other regions.
Africa recorded the highest increase at 12%, with its 15 million-TEU-plus ports handling 39.3 million TEU. Latin America followed with growth of 11% to 45.3 million TEU.
The Indian Subcontinent increased 10% to 35.3 million TEU, while the Middle East grew 8% to 44.6 million TEU. North Europe expanded 7%, the Far East 6%, North America 4%, the Mediterranean 3% and Australasia 2%.
Shanghai remains the world’s largest container port
Shanghai retained the top position in the global port ranking after handling 55.06 million TEU in 2025, an increase of 7% from 51.51 million TEU in 2024.
Singapore remained the world’s second-largest container port, with throughput rising 9% to 44.66 million TEU.
Ningbo ranked third after recording one of the strongest growth rates among the world’s largest ports. Its throughput increased 12% to 43.87 million TEU from 39.31 million TEU in 2024.
Shenzhen maintained fourth place with 35.41 million TEU, up 6%, while Qingdao ranked fifth with 32.89 million TEU following 7% growth.
Overall, 19 ports handled more than 10 million TEU during the year. The group included Antwerp, Busan, Dubai, Guangzhou, Hong Kong, Laem Chabang, Los Angeles, Ningbo, Port Klang, Qingdao, Rotterdam, Shanghai, Shenzhen, Singapore, Suzhou, Tangier, Tanjung Pelepas, Tianjin and Xiamen.
China leads millionaire-port throughput
China remained the largest national market in the DynaLiners ranking.
The country’s 30 ports handling more than 1 million TEU processed a combined 306.4 million TEU in 2025. This represented growth of 6% from 287.8 million TEU in the previous year.
The United States ranked second, with 13 qualifying ports handling a combined 55.55 million TEU, up 4%.
Singapore ranked third at country level with 44.66 million TEU, followed by Malaysia with 31.6 million TEU and South Korea with 30.39 million TEU.
Vietnam was another notable growth market. Its four million-TEU-plus ports handled 25.88 million TEU, an increase of 11% from 2024. India also recorded 12% growth, reaching almost 20 million TEU across four qualifying ports.
Twelve ports join the million-TEU club
The expansion of global container port throughput also brought 12 new ports above the 1 million TEU threshold.
Aqaba, Baltimore, Dar es Salaam, Dong Nai/Phuoc An, El Sokhna, Gdynia, Huanghua, Manaus, Rio Grande, Tanjung Emas, Vizhinjam and Wilhelmshaven were the new entrants in 2025.
Montevideo was the only port to drop out of the group.
In total, 135 of the 171 ports recorded positive growth during the year. Fourteen expanded by at least 25%, while 36 ports reported lower throughput. Haikou, down 28%, was the only port to record a decline of more than 25%.
The figures underline the broad expansion of container handling activity in 2025. While the world’s established container hubs continued to account for most volumes, ports below the 1 million TEU threshold collectively grew much faster than the millionaire-port group.
DynaLiners defines port throughput as full and empty containers loaded and discharged to and from ocean-going short-sea and deep-sea vessels, covering imports, exports and transshipment.
The report notes that some figures are estimated. It also highlights differences in reporting periods and port definitions, while noting that Chinese port statistics can include significant volumes of containerised river cargo.