
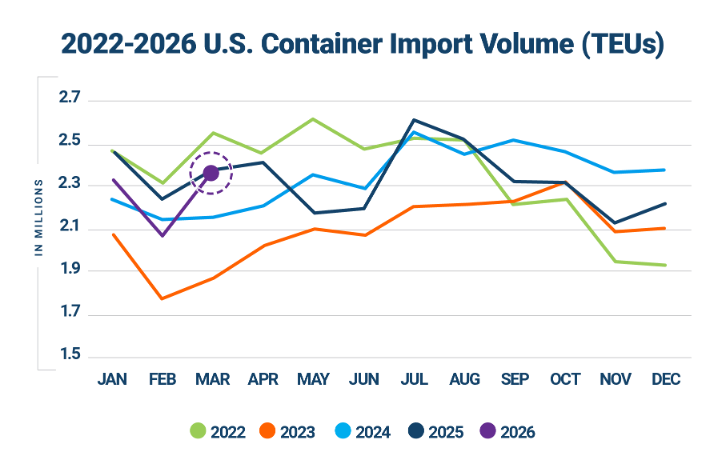
Descartes Systems Group reported that U.S. container imports rose 12.4% month-on-month in March 2026, reaching 2.35 million TEUs.
The increase marks a seasonal rebound from February levels. Volumes remained near historic highs, although they were slightly down compared to March 2025.
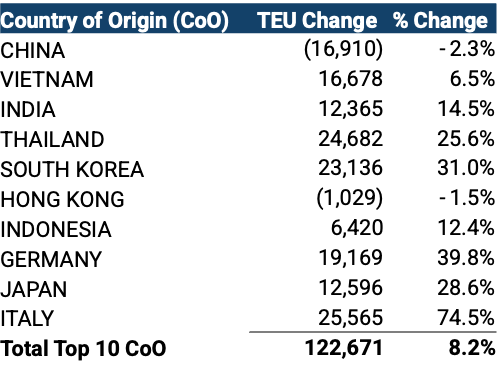
China volumes decline as sourcing shifts
Imports from China fell 2.3% month-on-month and 6.7% year-on-year. At the same time, imports from countries such as Italy, Thailand, South Korea, and India recorded strong gains.
This shift reflects ongoing diversification of sourcing strategies by U.S. importers.
East and Gulf Coast ports gain share
Ports on the U.S. East and Gulf Coasts overtook West Coast ports in market share for the first time since May 2025.
Port transit delays remained stable despite rising volumes.
Geopolitical risks disrupt shipping
Tensions in key regions continue to impact global trade. Disruptions in the Strait of Hormuz and risks around the Bab al-Mandeb Strait are affecting major shipping routes.
At the same time, evolving U.S. tariff policies and trade negotiations with the EU, India, and China are adding further uncertainty.
Focus on flexibility and risk management
Jackson Wood said importers are adapting by diversifying supply chains, adjusting routing strategies, and using data-driven tools to respond faster to market changes.
The report highlights a continued shift toward flexibility and risk management as companies navigate an increasingly volatile global shipping environment.


