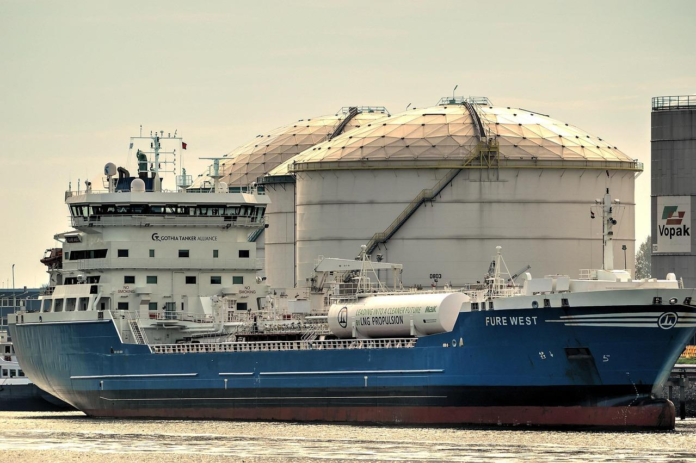
The Journey from Wells to Markets
Oil shipments begin their journey at production sites, most of which are concentrated in the Middle East, North America, and Russia. Crude oil supplies must travel thousands of miles to reach refineries and consumers, creating a logistics network that spans continents, and the transportation phase involves pipelines, tanker ships, rail cars, and trucks, each adding time and cost to the final product.
Major shipping routes include the Strait of Hormuz, which handles approximately 20% of global oil transit, and the Suez Canal, a critical chokepoint connecting Middle Eastern producers to European and North American markets. Any disruption along these pathways can immediately impact global supply availability and trigger price volatility.
Supply Chain Vulnerabilities and Price Sensitivity
The oil shipping infrastructure faces numerous vulnerabilities that directly translate to price movements.
- Weather events, such as hurricanes in the Gulf of Mexico, can shut down production facilities and disrupt shipping schedules for weeks.
- Geopolitical tensions in key shipping lanes can create supply uncertainties that markets quickly price into crude oil futures.
- Storage capacity at key terminals also influences pricing dynamics; when storage facilities approach capacity limits, traders must find alternative locations or accept lower prices, creating regional price differentials, but when storage levels drop significantly, competition for available supplies intensifies, driving prices higher.
Technology’s Role in Modern Oil Tracking
Advanced tracking technologies have revolutionized how industry participants monitor oil shipments. These include:
- Satellite surveillance
- Automatic identification systems on tankers
- Blockchain-based documentation
All these provide real-time visibility into global oil movements, and the transparency allows traders, analysts, and policymakers to better anticipate supply disruptions and market imbalances.
Market participants increasingly rely on detailed shipping data to inform their trading strategies — an oil price chart combined with shipping volume data provides a comprehensive view of market dynamics, helping identify potential price movements before they occur. It’s valuable information during periods of market uncertainty or supply disruptions.
Regional Impacts and Market Integration
Different regions experience varying degrees of oil price sensitivity based on their proximity to production centers and shipping infrastructure — landlocked areas typically face higher transportation costs and greater price volatility due to limited supply route options whereas coastal regions with multiple port facilities generally enjoy more stable pricing due to diverse supply sources.
The integration of regional markets depends heavily on shipping capacity and infrastructure quality. Improved pipeline networks and expanded port facilities can reduce price differentials between regions, while infrastructure bottlenecks can create persistent price disparities.
Oil shipping patterns continue adapting to changing demand centers and production locations, and the growth of shale oil production in North America has changed things up to an extent. Meanwhile, increasing environmental regulations may reshape shipping methods and routes, potentially affecting long-term price structures.
Understanding these shipping dynamics remains essential for anyone seeking to comprehend oil price movements and their broader economic implications.


