

Figure 1 illustrates this structural divergence across different Asia-Europe sub‑region corridors. The most significant finding is the high Coefficient of Variation (CV) – which is utilised to measure the volatility of transit times. A CV of 25‑35% on a 45‑day transit time indicates a 13‑16 day deviation compared to the average. This degree of volatility introduces substantial operational risk for shippers, not only with inventory planning, but also for downstream logistics.
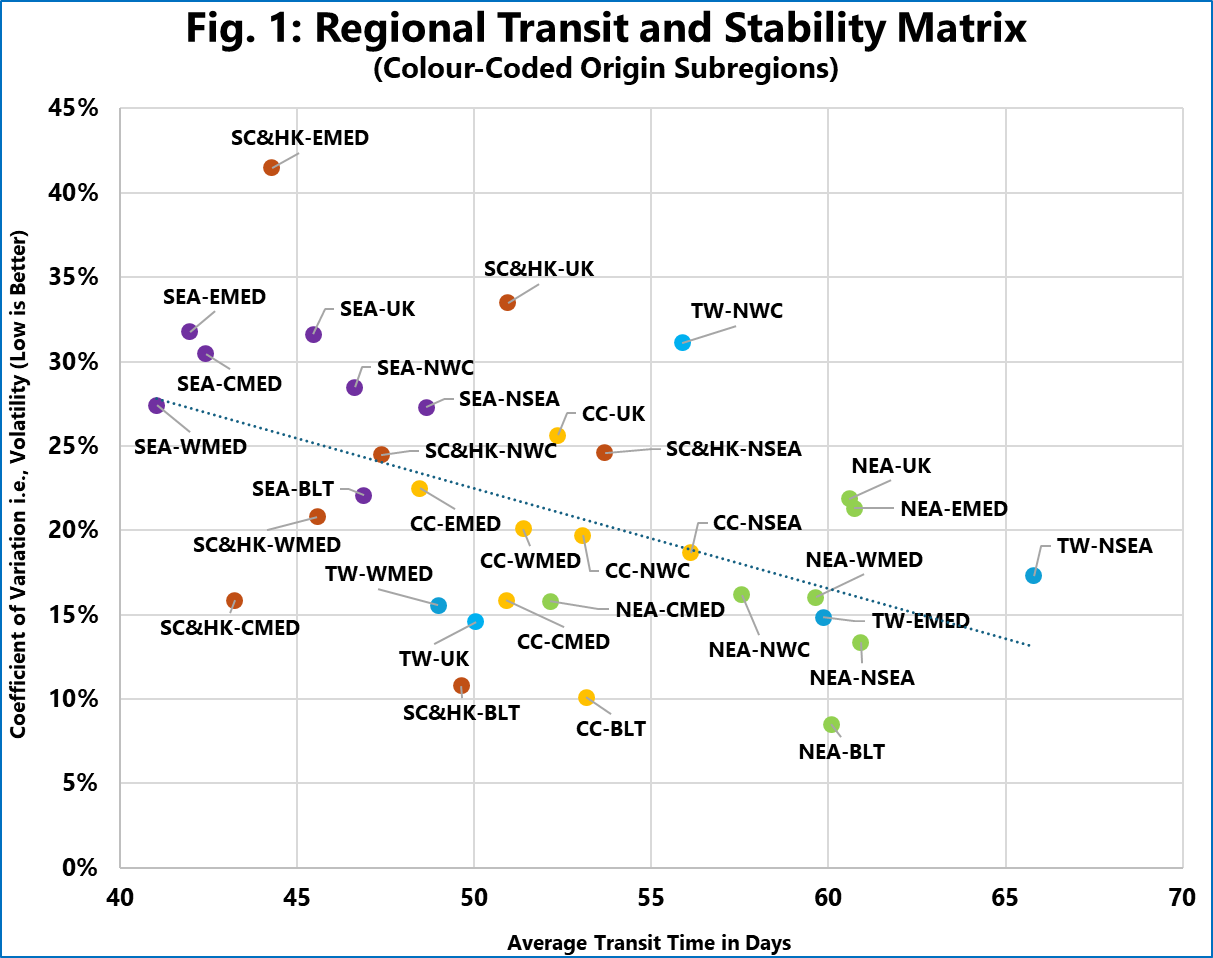
The data also reveals an inverse relationship between average transit times and CV, which indicates that carriers are facing a direct trade‑off between offering aggressive transit times with high volatility or significant schedule padding but with more predictable transit times. In these two extremes are Southeast Asia (SEA) and Northeast Asia (NEA) origins. What is fascinating here, is that the delta between the average transit time from NEA and SEA to the same destination regions far exceeds the sailing time between the two. This suggests that significant additional time buffers have been added to NEA rotations, to absorb a higher likelihood of delays encountered by ports at the start of the Asia loading leg.
This structural separation also indicates that geographic distance is no longer the sole determinant of Asia-Europe transit times. Instead, shippers face a market defined by the operational trade‑off made by the carrier alliances. Whether a corridor offers volatile high‑speed arrivals or slower, buffered transits, depends directly on the alliances’ chosen strategy for navigating the logistical constraints of the Cape routing.


