
To visualize the scale of this, they plotted every individual vessel deployed on the trade lane since 2012. This view allows us to distinguish between the standard fleet evolution and specific outliers that are reshaping the market.
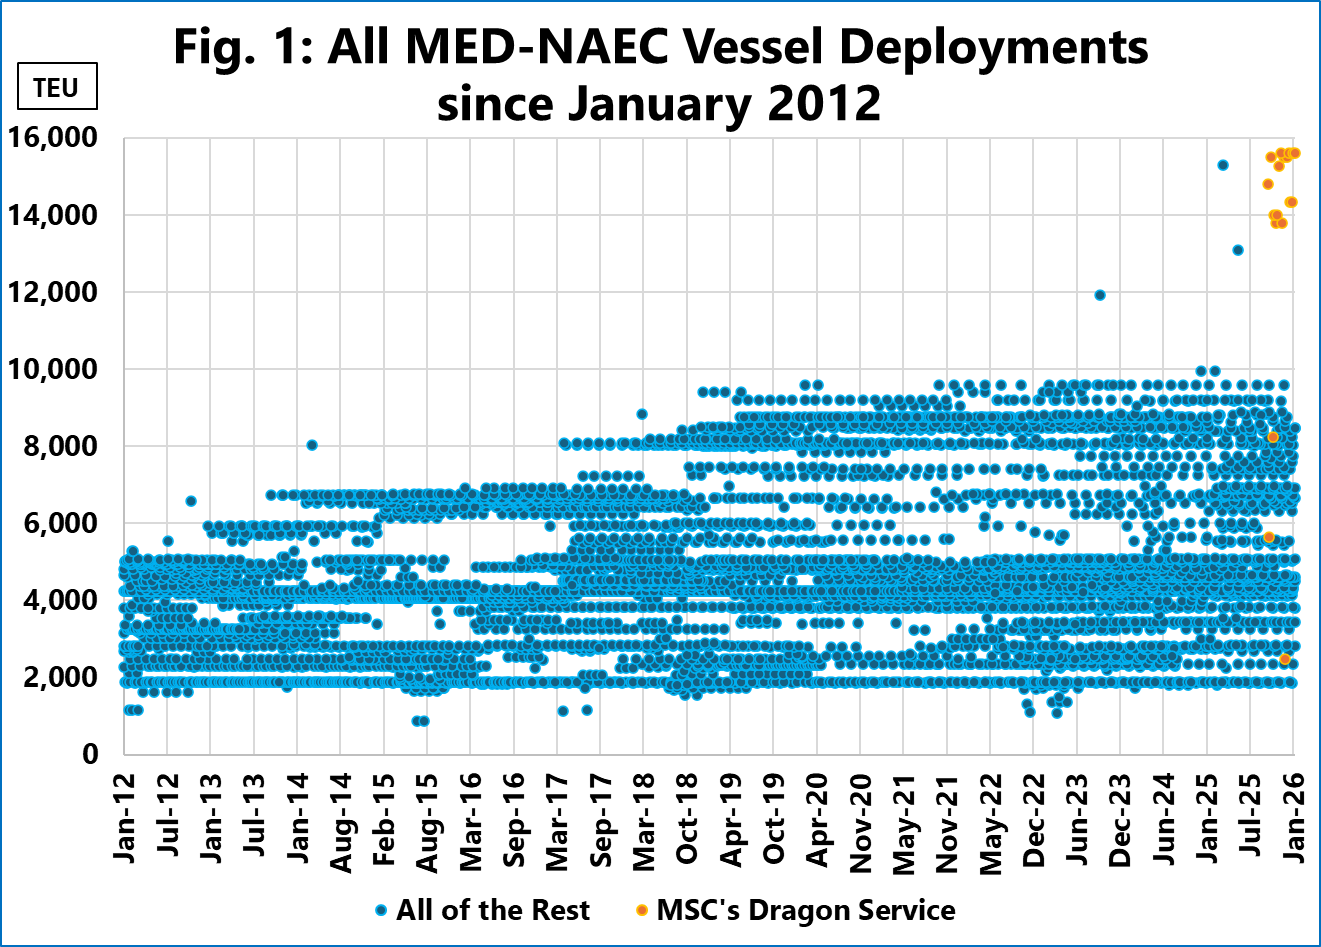
As shown in Figure 1, the market is defined by a dense primary cluster of vessels ranging from 800 TEU up to a clear historical ceiling of roughly 9,600 TEU. However, in 2025, a distinct second cluster emerges at the top right of the chart, consisting of vessels in the 13,000-15,000+ TEU range. Of those, 2 (in blue) were deployed by MSC on their EMUSA service. However, these serve as outliers as the service continues to deploy 8,000-9,000 TEU vessels.
The rest (in orange) are deployed by MSC on their Dragon service. This represents the first stabilized service consistently deploying vessels of this size on this trade. This strategy has effectively created a two-tiered vessel size structure. The primary implication is a new, concentrated operational stress on North American East Coast terminals. These ports must now manage scheduled calls from a new class of vessel that is significantly larger than the trade’s standard, resulting in much higher container exchanges per call.


