
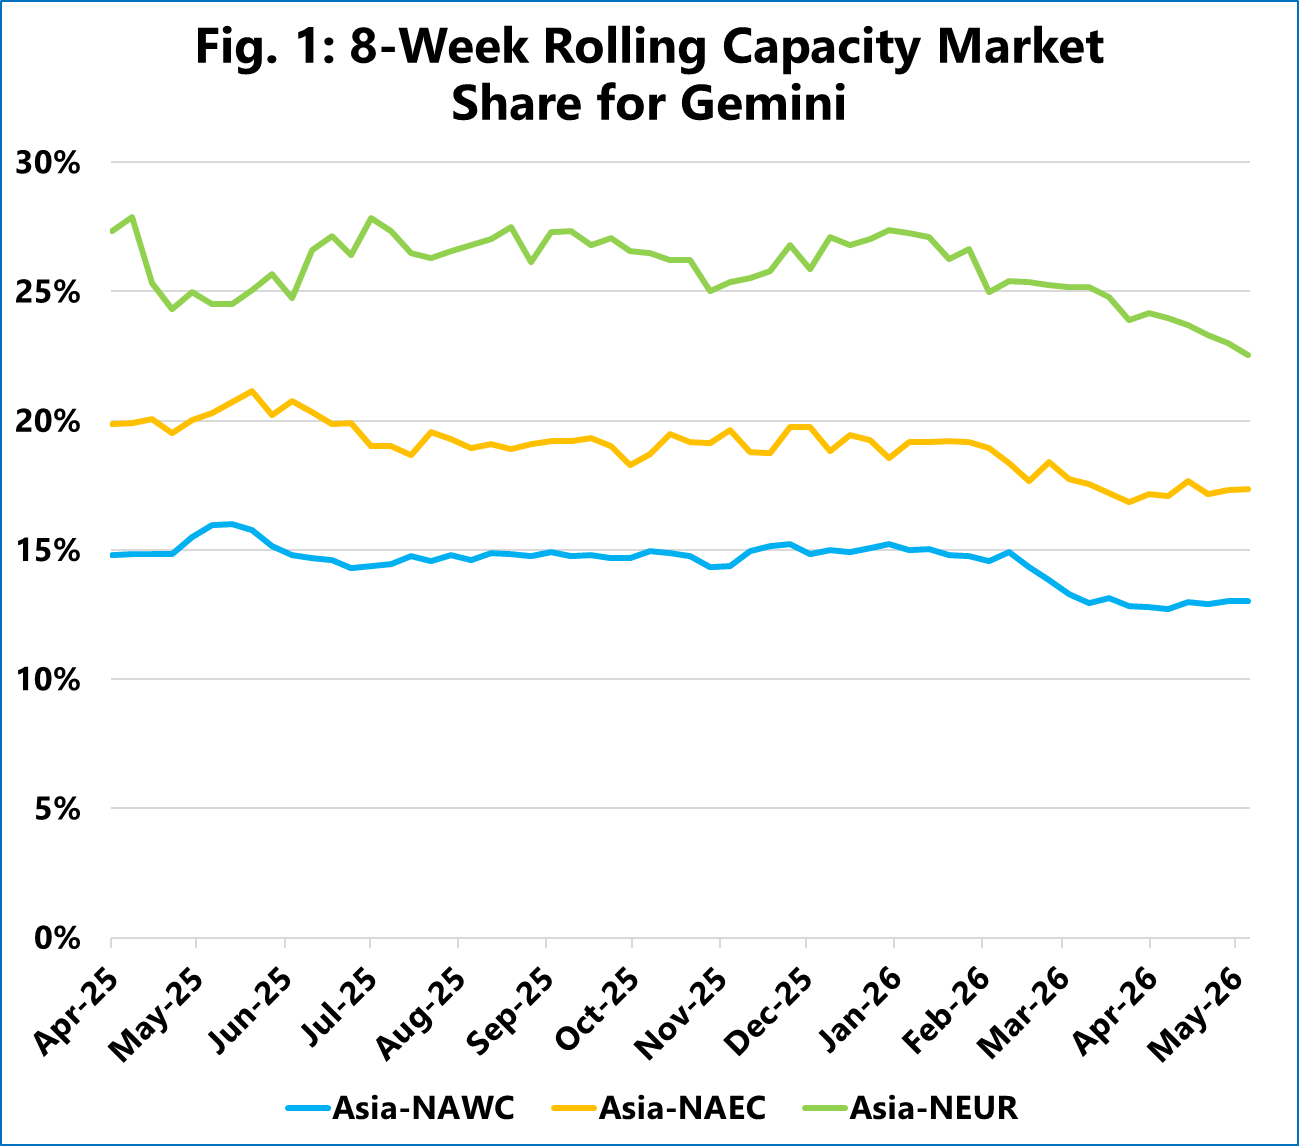
The rolling 8‑week average weekly capacity market share, as shown in Figure 1, demonstrates a clear downward trajectory for Gemini. Between April 2025 and May 2026, Gemini’s share of Asia‑North America West Coast weekly deployed capacity is projected to contract from 15% to 13%. Concurrently, the Asia‑North America East Coast trade lane is seeing a reduction from 20% to 17%, and Asia‑North Europe is declining from 27% to 23%. On all three, the contraction almost exclusively happens within a narrow window from mid‑February and May 2026.
While a declining capacity market share typically indicates a withdrawal of deployed capacity, the raw TEU figures reveal a different underlying mechanic. Since Gemini’s weekly deployed capacity remains relatively flat across these trade lanes, the declining capacity market share is a direct consequence of expanding total market deployment, which, following the Chinese New Year dip, is rebounding with immense speed. This market expansion is primarily being driven by Ocean Alliance, scheduling close to the maximum design capacity on their services on these trade lanes, with hardly any blank sailings.
This structural separation highlights two fundamentally different operational models. Ocean Alliance’s capacity growth is accompanied by high weekly volatility, indicating a highly elastic network architecture where the alliance scales its supply to absorb expanding market volume. Gemini, by contrast, displays a low volatility profile.
Their rigid deployment pattern points to a synchronized, closed‑loop network that does not structurally flex to capture sudden market surges. The resulting outcome is a distinct operational trade‑off: Gemini is providing a stable weekly capacity baseline, but because that baseline remains locked while competitors expand their supply, Gemini mathematically cedes relative market share.


