
Containerized trade to/from/within the Middle East/Indian Subcontinent grew by a substantial 7% year-on-year to 16.1 million TEU according to provisional figures from Container Trades Statistics.
All three segments posted growth with imports demonstrating the strongest performance following an 8% increase.
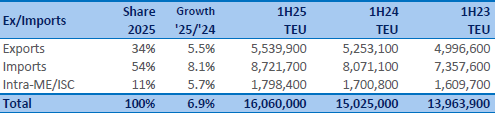
Exports also achieved reasonable 5-6% growth, though this represented the weakest performance of the three categories. With this also being the weaker of the intercontinental legs, the imbalance grew by 364,000 TEU to approach 3.2 million TEU.
Containerized exports from Middle East/Indian Subcontinent increased by 287,000 TEU to exceed 5.5 million TEU.
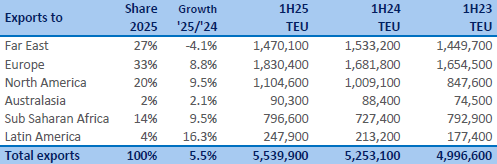
Notably, only exports to the Far East declined, falling by over 4.1%. North America and sub-Saharan Africa posted the fastest growth rate at 9.5%.
However, the 8.8% growth of the largest single trade Europe meant that this route added the most containers at 149,000 TEU.
Containerized imports into Middle East/Indian Subcontinent reflected a substantially different pattern as, in this case, the Far East trade was the clear leader. It grew at the fastest rate of 14.0% and as the dominant trade, resulted in the largest physical gain as well, totaling 652,000 TEU.
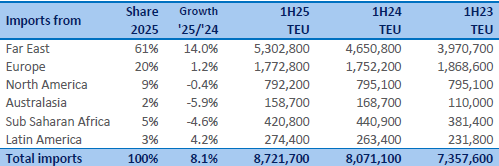
The considerably slower growth rates for imports from Europe and Latin America resulted in only an additional 32,000 TEU combined.
Elsewhere, imports from Australasia declined by 5.9% although sub-Saharan Africa lost more containers at 20,000 TEU.


